I Needed Logs, Not a PhD in Elasticsearch — So I Built Logwell
TL;DR
Every logging tool felt like overkill for side projects—ELK needs a DevOps team, Datadog charges per-GB, Loki requires learning LogQL. So I built Logwell: PostgreSQL tsvector for search, SSE for real-time, one Docker Compose to deploy.
Key Takeaways
- ELK Stack operational overhead is insane for side projects—multiple components, capacity planning, JVM tuning.
- Datadog charges $0.10/GB ingest + $1.70/million events indexed. For 100GB/month, that's $170+.
- PostgreSQL tsvector with weighted search gives you 80% of Elasticsearch's text search with 5% of the complexity.
- SSE batching (1.5s window + 50-log max) balances latency vs throughput better than naive streaming.
- Claude Code accelerated architecture decisions and boilerplate—but I had to course-correct on performance patterns.
- TDD with Trophy testing (integration-heavy, red-green-refactor) caught subtle bugs in SSE batching and pagination before production.
Logwell is a self-hosted logging platform built on PostgreSQL with tsvector full-text search, Server-Sent Events for real-time streaming, and a single Docker Compose deployment. It handles millions of logs on a $6 VPS — no Elasticsearch cluster, no LogQL, no per-GB billing.
I wasted an entire Saturday trying to set up logging for a side project.
Not building features. Not fixing bugs. Just trying to see what my app was doing when it crashed at 2 AM. I opened the ELK Stack docs, saw the words “JVM heap sizing” and “shard allocation strategy,” and closed the tab. I’m running a Telegram bot, not Netflix.
Loki looked promising until I realized I’d need to learn LogQL (which isn’t grep, despite what the docs imply) and set up Grafana just to see my logs in a browser. That’s two more services to babysit.
Datadog? I did the math on their pricing page. $0.10 per GB ingested, plus $1.70 per million log events indexed. My PickMyClass scraper generates maybe 50GB of logs a month during peak registration season. That’s $85 just to ingest, before I can even search anything. For a project that makes $0.
I don’t have a DevOps team. I have mass assignments due and a thesis to procrastinate on.
What’s Actually Wrong With Existing Tools
I’m not saying these tools are bad. They’re built for companies with SRE teams and logging budgets. The problem is there’s nothing in between “roll your own syslog” and “enterprise observability platform.”
Loki is the closest to what I wanted. Lightweight, labels-based, pairs well with Prometheus if you’re already in that ecosystem. But I’m not. And the query language has this weird syntax where you chain parsers and filters that took me an hour to figure out for a simple “show me errors from the last hour” query. The Grafana dependency is the dealbreaker, I don’t want to run Grafana just for logs.
ELK is what everyone recommends, and everyone who recommends it either (a) has a managed Elastic Cloud subscription, or (b) hasn’t actually operated an Elasticsearch cluster. I tried self-hosting it once for another project. Spent more time tuning garbage collection and worrying about split-brain scenarios than actually looking at logs. Never again.
Datadog and Papertrail solve the operational complexity by being managed. The tradeoff is you’re now paying per-GB, which creates this weird incentive where you start questioning whether you really need that debug log statement. Logging shouldn’t feel like a taxi meter.
What I wanted: a single Docker Compose file, a web UI, PostgreSQL because I already know it, and the ability to search “connection refused” across all my projects. That’s it.
Logging Tools Compared
| Tool | Setup Complexity | Monthly Cost | Search Speed | Real-time | Best For |
|---|---|---|---|---|---|
| ELK Stack | High (JVM tuning, shard allocation) | $0 self-hosted, $100+ managed | Fast | Yes | Enterprise with DevOps teams |
| Datadog | Low (managed) | $0.10/GB + $1.70/M events | Fast | Yes | Teams with logging budgets |
| Loki | Medium (Grafana required) | $0 self-hosted | Medium | Yes | Grafana/Prometheus ecosystem |
| Logwell | Very Low (one Docker Compose) | $0 (self-hosted on free VPS) | Fast enough | Yes | Side projects and personal use |
Logwell is embarrassingly simple compared to the others. That’s the point.
What I Actually Built
Logwell is embarrassingly simple compared to “real” logging platforms. That’s the point.
One Docker Compose with two services: the app (SvelteKit on Bun) and PostgreSQL. No Redis. No Kafka. No separate search cluster. Your logs go into Postgres and you query them with… Postgres.
The interesting part is making Postgres work for log search without becoming a performance disaster.
Full-Text Search That Doesn’t Suck
Postgres has this tsvector type that most people ignore. It’s a full-text search index that supports stemming, relevance ranking, and boolean operators. Not as powerful as Elasticsearch, but powerful enough.
I set up weighted search so the log message matters most, metadata is secondary:
search: tsvector =
  setweight(to_tsvector('english', message), 'A') ||
  setweight(to_tsvector('english', body::text), 'B') ||
  setweight(to_tsvector('english', metadata::text), 'B') ||
  setweight(to_tsvector('english', resourceAttributes::text), 'C')
A GIN index makes queries fast. Searching “database connection timeout” across 2 million logs takes ~200ms on my $6/month VPS. Not Elasticsearch-fast, but fast enough that I don’t notice.
The 80/20 rule applies here. Most log searches are “show me errors containing X from service Y in the last hour.” You don’t need inverted indices and distributed shards for that. You need a WHERE clause and an index.
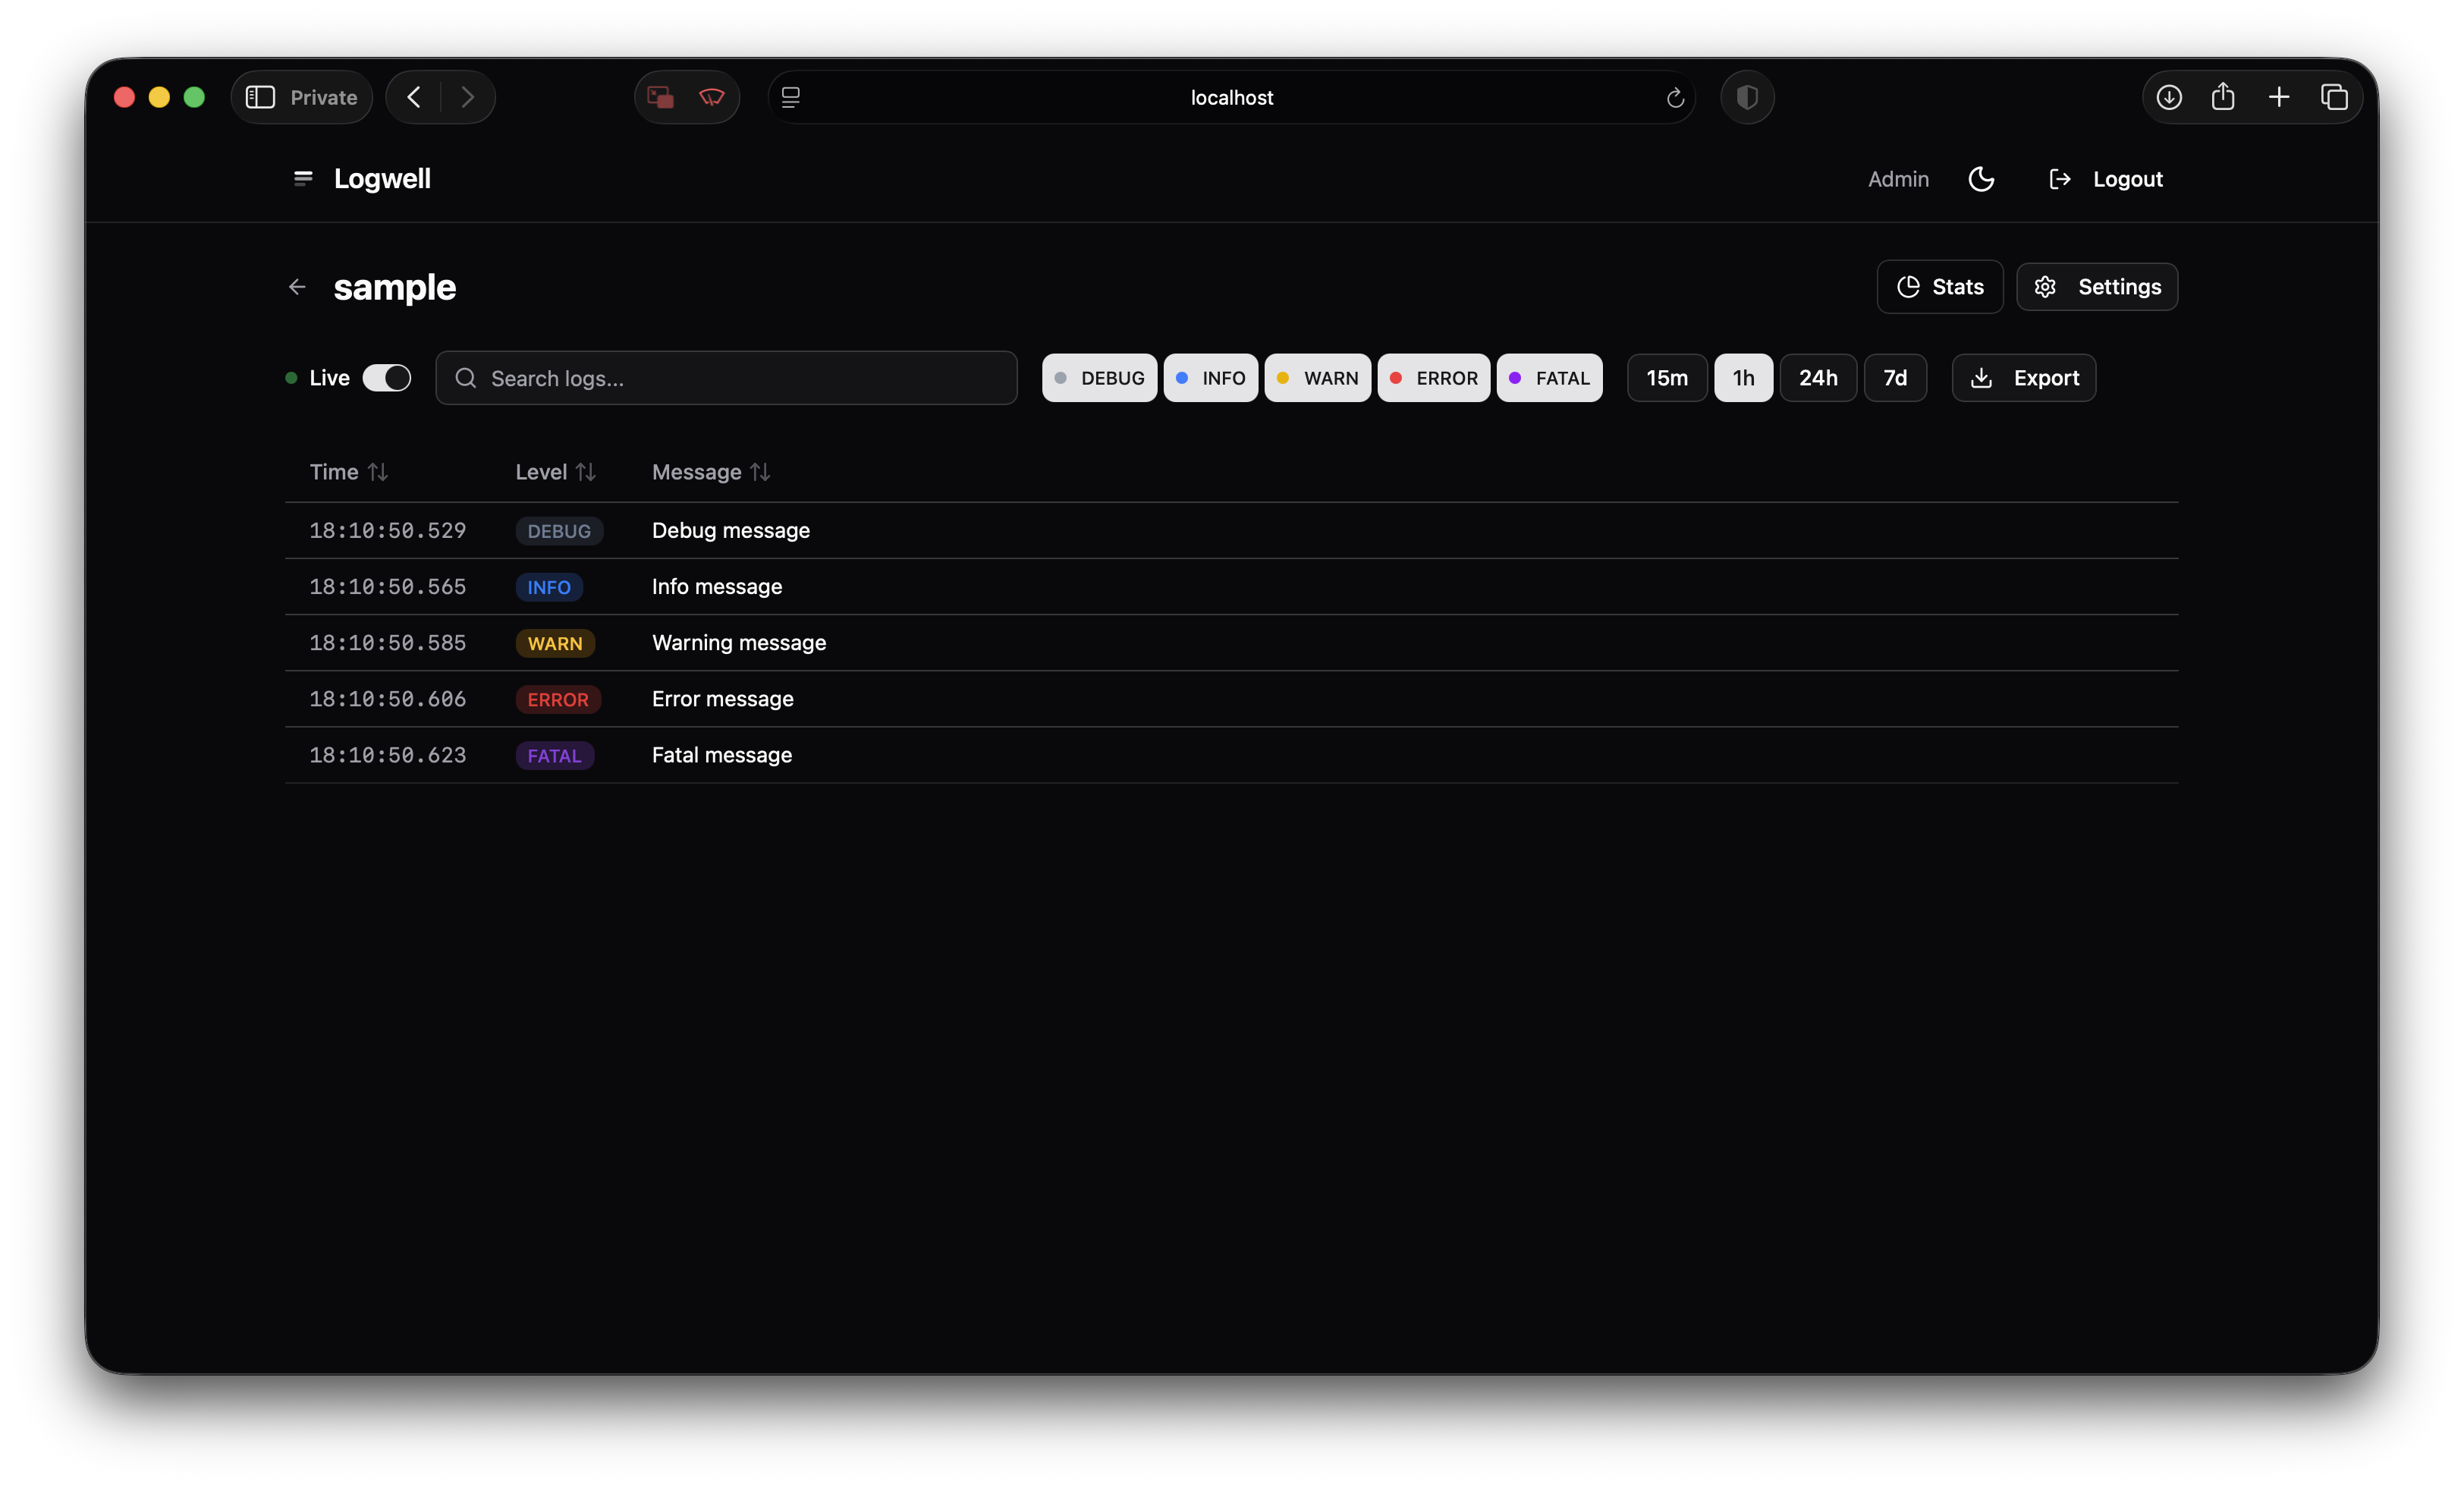
Real-Time Without Polling
I wanted to tail logs in the browser. The obvious approach is polling the database every second, but that felt gross.
The less obvious approach is PostgreSQL’s pg_notify, but at high log volumes you’re still hammering the database to check for notifications.
I went with an in-memory event bus. When a log comes in:
- Insert into Postgres
- Emit to in-memory pub/sub
- All connected SSE clients get the log
No database polling. The tradeoff is that the event bus doesn’t survive restarts, but for real-time tailing that’s fine, you’re watching live logs, not replaying history.
The SSE endpoint batches logs (flush every 1.5s or when 50 logs accumulate, whichever comes first) because sending one event per log at 100 logs/second will murder your browser.
The Claude Part
I used Claude Code for most of this project. Here’s what actually happened, not the sanitized “AI helped me be 10x more productive” story.
Architecture discussions genuinely helped. When I was deciding between pg_notify and an in-memory event bus, I described the tradeoffs and Claude walked through the implications. It correctly identified that for a single-server deployment, in-memory is simpler and the “doesn’t survive restarts” limitation doesn’t matter for my use case. I probably would’ve reached the same conclusion, but faster to talk it through.
Boilerplate generation is where it shines. Drizzle schema definitions, SvelteKit API routes, the whole shadcn-svelte component setup. I described what I wanted, Claude generated it, I reviewed and tweaked. Saved hours of typing.
But I caught real bugs that would’ve been painful in production.
The SSE batching logic had a subtle issue. Claude’s first version used setTimeout to flush the batch every 1.5 seconds, but didn’t clear the timeout when a size-triggered flush happened. So if 50 logs came in at once, it would flush immediately (correct), and then flush again 1.5 seconds later with an empty batch or duplicate data (incorrect).
// The bug: timeout keeps running after size-triggered flush
if (batch.length >= MAX_BATCH_SIZE) {
  flushBatch(); // but the setTimeout is still ticking...
}

// The fix: always clear timeout before flushing
const flushBatch = () => {
  if (flushTimeout) {
    clearTimeout(flushTimeout);
    flushTimeout = null;
  }
  // now flush
};
This is the kind of bug that works fine in testing (low volume, timeouts rarely overlap) and explodes in production.
Also: Claude’s first API key validation hit the database on every single request. I had to explicitly ask for a cache. It added a 5-minute TTL cache correctly once prompted, but didn’t proactively consider performance. Same with pagination, defaulted to offset-based, which breaks with concurrent inserts. Had to push for cursor-based.
My take: Claude accelerates the 70% of coding that’s “I know exactly what I want, just need to type it.” The other 30%, the subtle correctness issues, the performance footguns, the “this works but will bite you later”, still needs a human reviewing every line. If I’d shipped that setTimeout bug, I’d have spent hours debugging duplicate log entries in production.
How did I catch these bugs? TDD with the Trophy testing strategy. Red-green-refactor: write a failing test, make it pass, clean up. The Trophy part means leaning heavily on integration tests, they give you more confidence than unit tests without the brittleness and slowness of full E2E. I wrote tests for SSE batching behavior (simulating rapid log bursts that trigger both time and size flushes), tsvector search ranking (verifying message matches rank higher than metadata matches), cursor pagination under concurrent inserts, and API key validation caching. The setTimeout bug showed up immediately when the test fired 100 logs in quick succession and asserted no duplicate batches. Would’ve been a nightmare to debug in production; took 5 minutes to catch with a proper test.
Stuff I Learned Building This
SSE is underrated for server-to-client streaming. Everyone defaults to WebSockets, but SSE is simpler, works through proxies without special config, and has automatic reconnection built into the browser API. The one thing to know: you need heartbeat events every 30 seconds or proxies and load balancers will kill the connection on you.
Postgres keeps surprising me. I keep reaching for specialized tools, Redis for caching, Elasticsearch for search, RabbitMQ for queues, and keep learning that Postgres can do 80% of what I need with less operational overhead. Generated columns compute the tsvector on insert. GIN indexes make search fast. It won’t handle petabyte-scale logs, but my side projects will never have petabyte-scale logs.
Fail fast on configuration. Logwell crashes on startup if DATABASE_URL is missing or SSE_BATCH_WINDOW_MS is outside valid bounds (100-10000ms). Annoying during development, but way better than mysterious failures in production when some code path finally reads an invalid env var three hours after deploy.
Cursor pagination is the only sane choice for real-time data. Offset-based (LIMIT 100 OFFSET 200) breaks as soon as new logs come in, you get duplicates, skip entries, it’s a mess. Cursor-based (“give me 100 logs older than this timestamp+id”) always works.
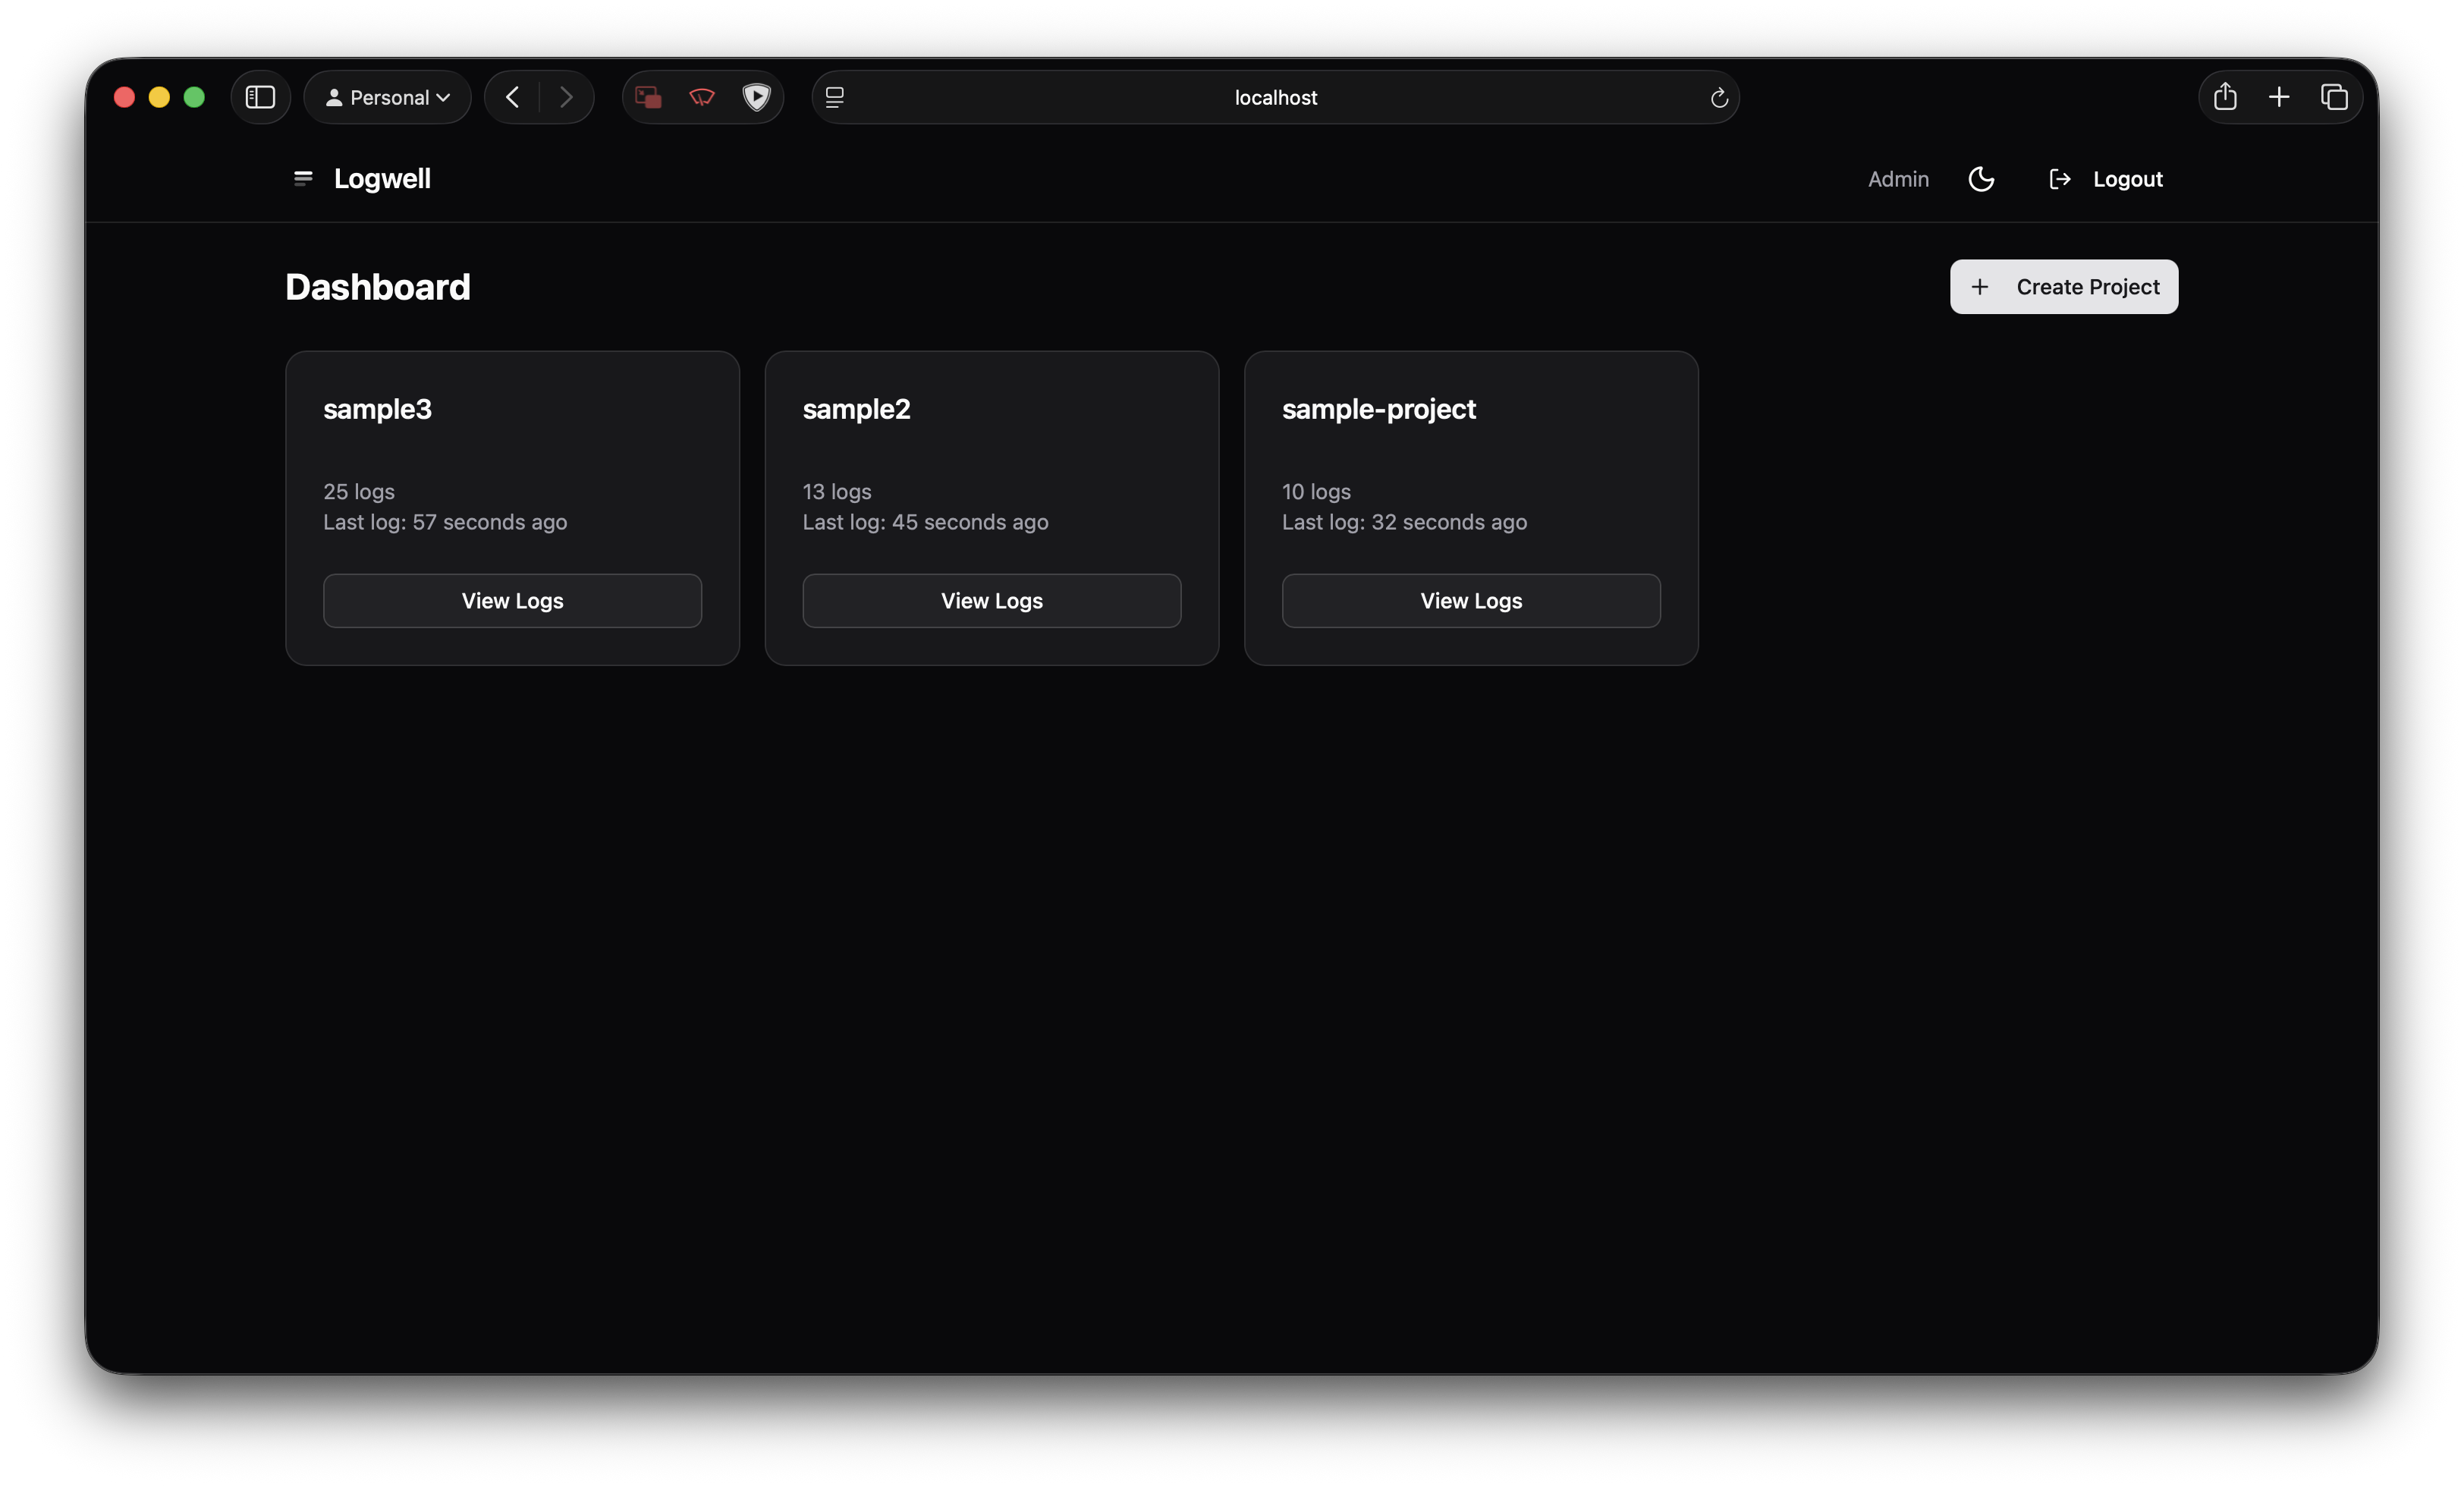
How I’m Actually Using It
Logwell runs on my VPS, collecting logs from Alita Robot (the Telegram bot) and the PickMyClass scraper. Around 800K logs in the database right now, oldest from about 3 months ago.
Honestly? Nothing’s broken yet that required serious debugging. The main use so far is watching deploys, I push a new version, open Logwell, and watch logs scroll as the app restarts. Catches startup errors immediately instead of finding out 20 minutes later when users complain.
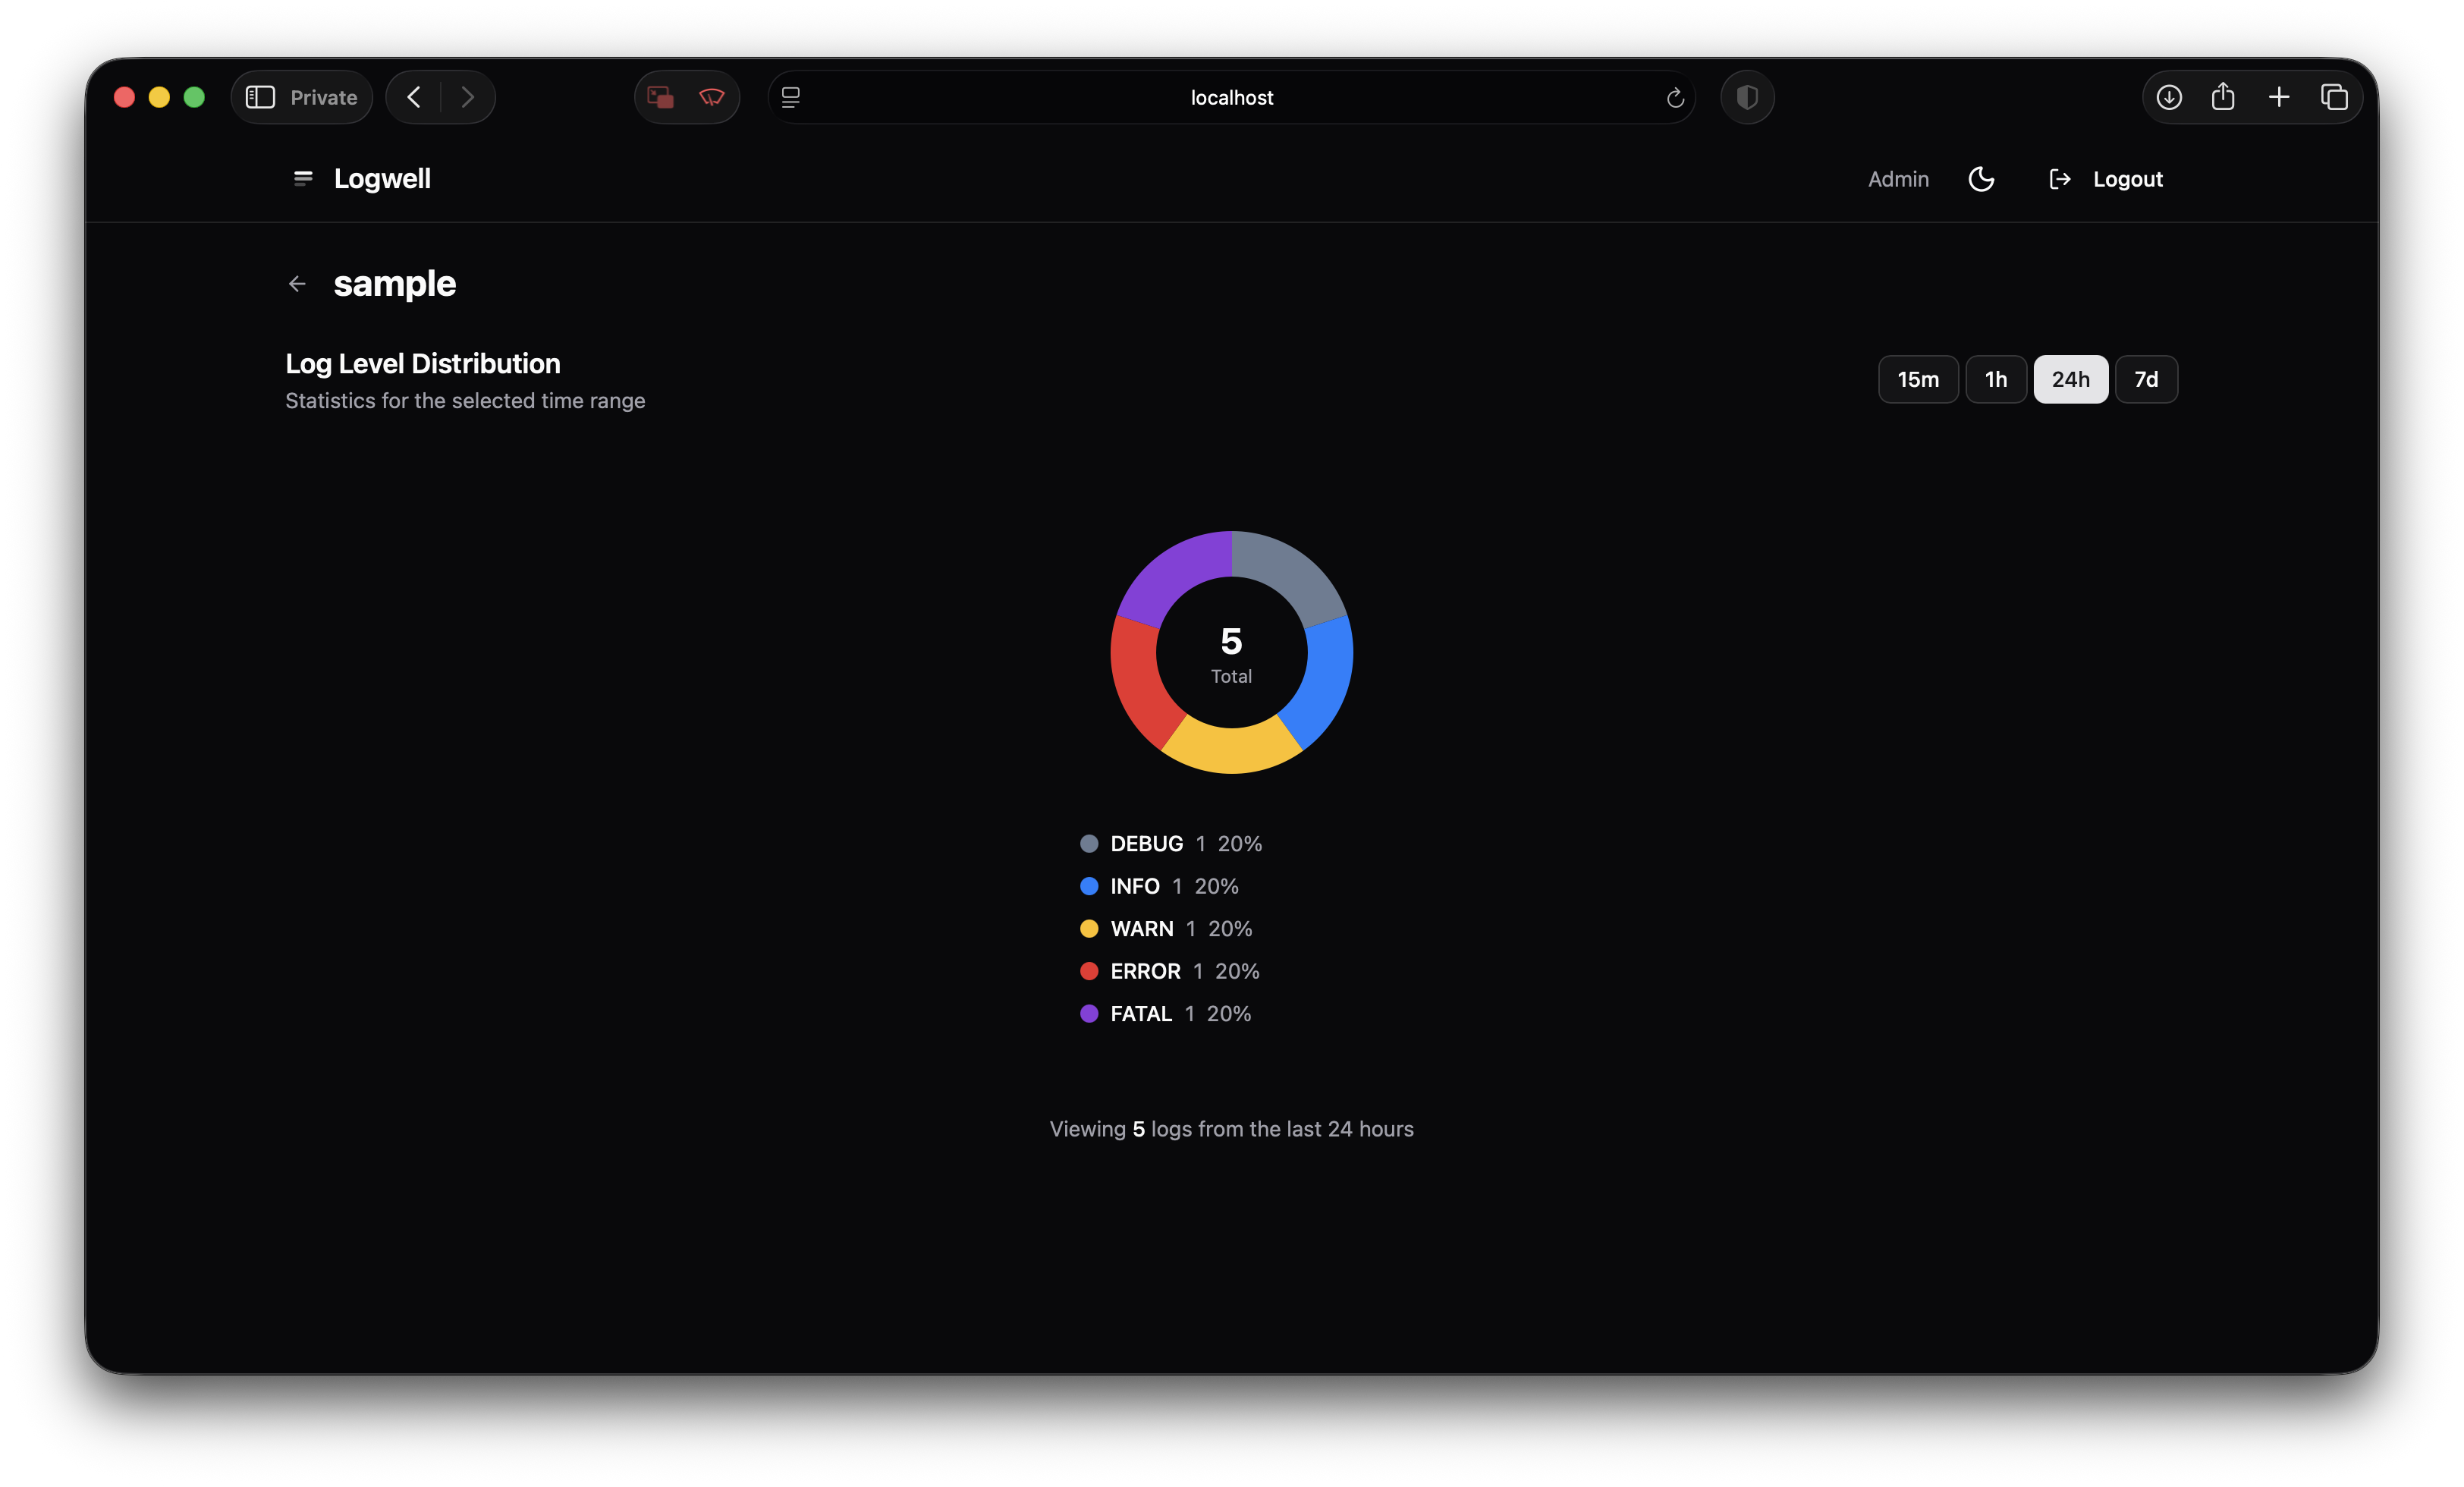
The other use is just… seeing what’s happening. Searching for a specific user’s requests when they report something weird. Checking if the scraper actually ran last night. Filtering to warn/error levels to spot patterns I might’ve missed. It’s less “debugging fires” and more “ambient awareness of what my stuff is doing.”
The SDK is minimal:
import { Logwell } from 'logwell';

const logger = Logwell.create({
  apiKey: 'lw_xxx',
  endpoint: 'https://logs.example.com',
  service: 'pickmyclass-scraper'
});

logger.error('Scrape failed', {
  url: targetUrl,
  statusCode: response.status,
  retryCount: 3
});
Batches client-side, retries on failure, nothing fancy. Just works.
What’s Missing (Honestly)
Logwell doesn’t have:
- Multi-user/teams — Single user only. Fine for personal projects, not for teams.
- Rate limiting — A runaway logging loop could fill your disk. I haven’t built protection against this yet.
- Alerting — No “notify me when error rate exceeds X.” I still use Uptime Kuma for that.
It’s a logging viewer for side projects, not a replacement for Datadog if you actually have a budget and an SRE team. But for my use case, seeing what my personal projects are doing without paying per-GB or operating a distributed system, it’s exactly what I needed.
Code’s on GitHub. One-click deploy buttons for Railway, Render, and Fly.io if you want to try it.
Related Posts
- My 2026 Stack for Shipping Side Projects — The full toolkit, including why centralized logging matters
- PickMyClass: Never Miss Your Dream Class — The scraper that generates most of my logs
- Vibe Coding in 2026 — When AI-generated code works and when it bites you
Frequently Asked Questions
Why not just use Loki?
Loki requires learning LogQL and has no built-in UI—you need Grafana. For side projects, I wanted something simpler with batteries included.
Can PostgreSQL handle high log volumes?
With proper indexing (GIN on tsvector, composite indexes on project+timestamp), PostgreSQL handles tens of millions of logs. For most side projects, this is more than enough.
Is this production-ready?
I'm running it in production for my own projects. It's single-user, no rate limiting—but the core logging works reliably.
How does the real-time streaming work?
In-memory event bus + Server-Sent Events. No database polling. Logs hit the DB and broadcast simultaneously.
Sources & References
Related Posts
I Spent $600 Testing AI Coding Tools: Claude Code vs Cursor vs Copilot (2026 Results)
I've spent $50+/month on AI coding tools for a year. Here's what actually works, what's overhyped, and when to use each tool (including free local LLMs).
AI Models Compared 2026: GPT-5.6 vs Claude Opus 4.8 vs Grok 4.5
July rewrote the leaderboard. Fable 5, GPT-5.6 Sol, Grok 4.5, Muse Spark 1.1, Kimi K2.7-Code, Cognition SWE-1.7, GLM 5.2, and MiniMax M3. What holds up for coding, agents, and cost.
I Built a Full-Stack AI App on Cloudflare Workers With D1, Durable Objects, and Queues — Here's What Actually Worked
Upload a PDF resume, get a live web portfolio. I built clickfolio.me entirely on Cloudflare's edge stack, D1 for data, R2 for files, Queues for async processing, Durable Objects for real-time WebSockets, and Gemini for AI parsing. Here's every technical decision, including the ones I regret.

Divanshu Chauhan (@divkix)
Software Engineer & MS CS @ Arizona State University. Currently SWE Intern @ Cloudflare. Based in Tempe, Arizona, USA.
Expertise: Logging, Self-Hosted, PostgreSQL, SvelteKit. More about divkix